
Renting usually wins financially if the property cash-flows after real expenses, you expect steady appreciation, and you can sell within the Section 121 window before it closes. Selling usually wins if you need the equity now, the numbers are thin, or you’re past that tax deadline. Either way, the right decision metric isn’t monthly cash flow. It’s after-tax net worth over a holding period you actually pick, built from three inputs: net rental cash flow, appreciation, and tax timing.
TL;DR:
- Analyzing after-tax net worth over a chosen period provides a more accurate comparison than just looking at monthly cash flow, incorporating appreciation and tax timing.
- Rental property costs often exceed gross rent by 5% to 8%, accounting for vacancy, maintenance, taxes, management, and tenant-related expenses, which erodes rental yields.
- Selling involves upfront costs of 6% to 10% of the sale price for agents and closing, with proceeds that need reinvestment at expected after-tax returns to compete with rental appreciation and cash flow.
- The Section 121 exemption allows homeowners to exclude up to $250,000 or $500,000 of capital gains if they meet residency requirements, but the three-year sell-by window is critical.
- Small changes in appreciation rate or vacancy assumptions can flip the better financial path between renting and selling, emphasizing the importance of sensitivity analysis.
Table of Contents
- How Do You Compare Rent vs Sell Financially?
- What Does It Really Cost to Rent Out Your House?
- What Does Selling Actually Cost, and Where Does the Money Go?
- How Do Section 121 and Depreciation Recapture Change the Numbers?
- Beyond the Numbers: Do You Actually Want to Be a Landlord?
- A Worked Example: Renting vs Selling Over 5 Years
- How This Calculation Actually Works
- When Does Renting Make Sense, and When Should You Just Sell?
- Sell Fast Without the Landlord Learning Curve
- Sources
- FAQ
How Do You Compare Rent vs Sell Financially?
Most homeowners compare rent versus sell by putting the rent check next to the mortgage payment and calling it a day. That’s the wrong test. A property can generate positive monthly cash flow and still lose you money compared to selling, once you account for what your equity would earn elsewhere and what taxes take at the finish line.
The right approach is an after-tax net-worth comparison: add up everything you’d have, after taxes, at the end of a chosen holding period under each scenario, then see which number is bigger. For the rent path, that means rental cash flow plus mortgage paydown plus appreciation, minus the taxes you’ll eventually owe. For the sell path, it means your net sale proceeds invested and growing, minus capital gains tax already paid.
A working calculator needs these inputs:
- Monthly rent and a realistic vacancy assumption
- Operating expenses: maintenance, property taxes, insurance, HOA, utilities you cover
- Property management fee, if you’re not self-managing
- Annual appreciation rate for the property
- Remaining mortgage balance, rate, and amortization schedule
- Selling costs if you go that route instead
- Expected investment return on sale proceeds if you sell and invest
- The holding period you’re testing (commonly 3, 5, or 10 years)
- Your marginal tax rate and capital gains rate
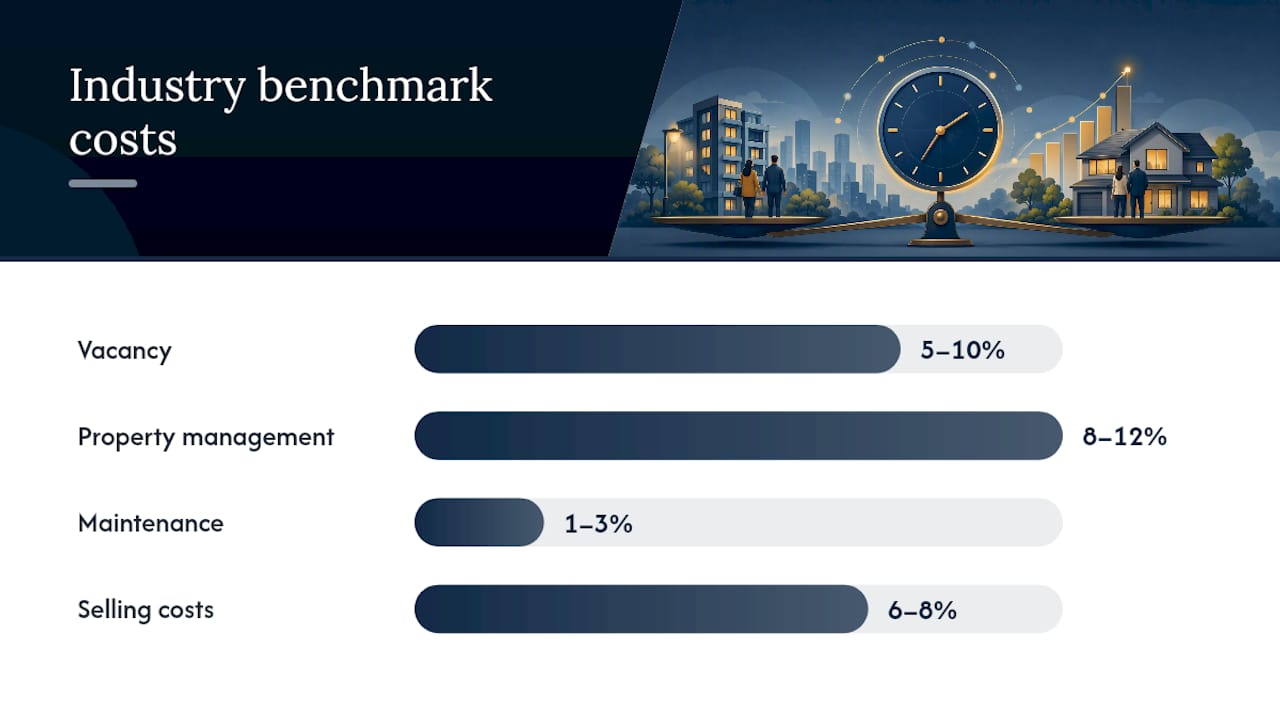
Industry benchmarks make these inputs less of a guess. Budget vacancy at 5% to 10% of gross rent, property management at 8% to 12% of collected rent, maintenance at 1% to 3% of the property’s value annually, and selling costs at 6% to 8% of sale price. Skip any of these and the rental side of your comparison looks far better than reality.
Opportunity cost is the piece most homeowners forget entirely. If you sell and net $150,000, that money doesn’t sit still. It goes into the market, a business, or another property, and it earns something. Kiplinger frames this correctly: the equity trapped in a rental is capital that isn’t compounding somewhere else, and any honest comparison has to price that in.
If renting only wins in the optimistic case, that tells you something the base case alone won’t.*
Sensitivity checks matter more than the base-case number. Tools built for this kind of scenario testing show that small changes in vacancy or appreciation assumptions can flip which path wins, which is exactly why a single-scenario spreadsheet is misleading on its own.
What Does It Really Cost to Rent Out Your House?
Gross rent is not net rent. The gap between the two is where most homeowners’ rental math falls apart, and it’s usually bigger than they expect.
Here’s what actually comes out of that rent check before you see a dime:
- Vacancy losses between tenants, typically 5% to 10% of annual rent
- Maintenance and repairs, running 1% to 3% of the property’s value per year
- Property taxes and homeowner’s insurance (often higher for a rental than an owner-occupied policy)
- HOA dues, if applicable
- Utilities, if you cover any as the landlord
- Property management fees of 8% to 12% of collected rent if you don’t self-manage
- Tenant acquisition costs: listing fees, background checks, lease preparation
Capital expenditures deserve their own line item, not a shrug. A new roof, water heater, or HVAC system doesn’t happen every year, but when it happens, it’s a five-figure hit. Annualize these costs by estimating replacement timing and dividing the expense across the years leading up to it, rather than letting a surprise repair wreck a single year’s numbers.
Once all of that is subtracted, residential rentals typically land in a 5% to 8% net yield range. Former primary residences often come in below that, since they weren’t bought with rental cash flow in mind and frequently carry a higher price-to-rent ratio than a property purchased specifically as an investment.
Hiring a property manager changes this math directly: you trade 8% to 12% of rent for someone else handling tenant screening, maintenance calls, and evictions. That trade often makes sense if you’re moving out of the area, but it needs to be built into your net number, not treated as an afterthought.
The risks that don’t show up in a spreadsheet are the ones that hurt most: a non-paying tenant who takes months to evict, a lease violation that drags you into local landlord-tenant court, or a major system failure right after you’ve spent your reserve fund on something else.
What Does Selling Actually Cost, and Where Does the Money Go?
Selling has its own cost structure, and it front-loads most of the pain into a single transaction rather than spreading it across years.
The line items to budget for:
- Real estate agent commissions
- Closing costs (title, escrow, transfer taxes, attorney fees depending on your state)
- Pre-sale repairs and updates to get the home market-ready
- Staging costs
- Carrying costs while the home sits on the market: mortgage, utilities, insurance
Combined, these typically run 6% to 10% of the sale price. Apply that range to your expected sale price to get real net proceeds, not the sticker price you see in a comparable-sales search.
What happens to those proceeds matters just as much as the sale itself. If you’re modeling the sell path against the rent path, the sale proceeds need to go somewhere: an index fund, a new down payment, a business. Whatever expected return you assign to that reinvestment, after taxes, is the number that competes against the rental cash flow and appreciation on the other side of the comparison.
If you’re short on cash for a new down payment, need to pay off debt, or simply want the equity liquid, that need for liquidity can outweigh a mathematically attractive rental scenario.
How Do Section 121 and Depreciation Recapture Change the Numbers?
The single biggest lever in this decision is a tax rule most homeowners have never heard of: the Section 121 exclusion. If you’ve owned and lived in the home as your primary residence for at least 2 of the last 5 years, you can exclude up to $250,000 of capital gains from tax if you’re single, or $500,000 if you’re married filing jointly.
The Section 121 clock is the most time-sensitive number in this entire decision. Once you move out, you generally have about three years to sell and still qualify for that exclusion, since the 2-out-of-5-year test looks backward from your sale date. Miss that window and you’re paying capital gains tax on appreciation you could have taken tax-free.
Depreciation adds a second wrinkle. While you rent the property, you can deduct a portion of its value each year against rental income, which lowers your tax bill in the short term. This is a real cash cost at the finish line, not just a paper adjustment, and it’s easy to forget after several years of enjoying the annual deduction.
Rental income itself is taxed as ordinary income, offset by deductible expenses including mortgage interest, property taxes, insurance, management fees, and depreciation. Losses may be limited by passive-activity rules if your income is high enough, which matters for higher earners weighing whether rental losses will actually offset other income.
In a calculator, this translates to two distinct entries: an annual line for rental income tax net of deductions, and a terminal line at sale for capital gains tax and depreciation recapture. Skip the terminal line and you’ll overstate how much renting actually earned you.
Beyond the Numbers: Do You Actually Want to Be a Landlord?
The spreadsheet doesn’t account for a 2 a.m. call about a burst pipe, and that’s a real cost even if it never shows up in a formula.
Before you commit to renting, be honest about a few things:
- Do you have the time and temperament to manage tenants, or would you need a property manager?
- If you’re moving away, remote management typically means paying that 8% to 12% management fee rather than self-managing
- How will keeping the property affect your ability to qualify for a mortgage on your next home?
That last point trips up more people than you’d expect. If you keep the rental and try to buy another house, lenders don’t count all your rental income toward qualifying. Fannie Mae guidelines generally let lenders count 75% of gross rental income, with the other 25% treated as a vacancy and expense cushion. That reduction can meaningfully shrink your borrowing power on the new mortgage, even if the rental cash-flows comfortably on paper.
If full-time landlording doesn’t fit your life but you’re not ready to fully rule out renting, a few middle paths exist: short-term or seasonal renting in the right market, a rent-to-own arrangement with a future buyer, or simply selling to a direct cash buyer to skip repairs, showings, and the financing contingencies that can sink a traditional listing. Property condition plays into this too. A rental in rough shape might need a turnover repaint before it’s rent-ready, and that kind of prep cost belongs in your operating budget, not treated as a one-time surprise.
A Worked Example: Renting vs Selling Over 5 Years
Here’s a scenario built to show how the math actually plays out, using assumptions you can swap for your own numbers.
- Rent for 5 years, then sell. Net rental cash flow after vacancy, maintenance, taxes, insurance, and management runs modestly positive most years. Add 5 years of appreciation on a $400,000 base at 3.5%, subtract selling costs and depreciation recapture at sale, and you land with a combined cash-flow-plus-equity position in the mid-$500,000s.
- Sell now and invest the proceeds. Net proceeds after 7% selling costs and the mortgage payoff come to roughly $158,000. Invested at 6% after tax for 5 years, that grows to somewhere around $211,000, well below the rent scenario’s total position in this particular baseline.
| Scenario | Key driver | 5-year result trend |
|---|---|---|
| Rent then sell | Appreciation + net cash flow | Higher, if vacancy stays low |
| Sell and invest | Reinvestment return | Lower unless invested return is strong |
Two sensitivity checks flip this result. Appreciation and vacancy are the two levers that move this outcome the most; taxes matter, but they rarely flip the winner on their own.
How This Calculation Actually Works
Every version of this model follows the same sequence: gross rent minus expenses gives net operating income, minus mortgage payments gives annual cash flow, plus mortgage principal paydown gives equity growth, and at the end, sale price minus selling costs minus remaining mortgage minus taxes owed gives terminal proceeds.
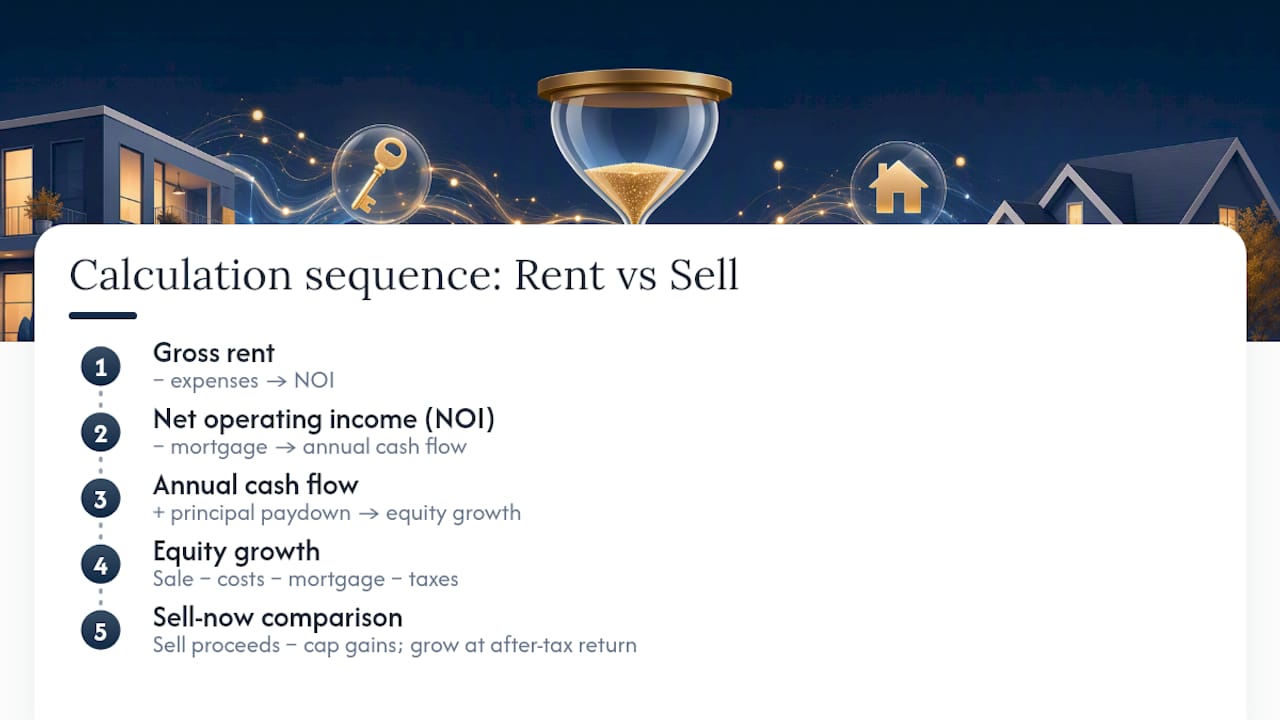
For the sell-now comparison, take those same terminal proceeds today, subtract capital gains tax if the Section 121 exclusion doesn’t fully cover the gain, and grow the remainder at your expected after-tax investment return.
The benchmark percentages used throughout this guide (vacancy, management, maintenance, selling costs) come from Experian’s landlord cost breakdown and are reasonable defaults for most markets. Run more conservative numbers if your local rental market is soft or you’re new to landlording, since first-year surprises tend to run higher than seasoned landlords budget for.
When Does Renting Make Sense, and When Should You Just Sell?
Three homeowner types should usually sell now: anyone who needs the equity for a new down payment, anyone whose Section 121 window is about to close, and anyone who’s run the numbers honestly and found the rental barely breaks even after real expenses. Three types should usually rent: anyone locked into a low fixed mortgage rate that the rent comfortably covers, anyone in a market with strong appreciation and low vacancy, and anyone willing to actually manage the property or pay a manager without resenting it.
If speed and certainty matter more to you than chasing the last dollar of rental upside, a direct cash sale is worth weighing honestly against the landlord path, not just as a fallback.
— Dave
Sell Fast Without the Landlord Learning Curve
If the math above pointed you toward selling but the idea of listing, repairing, and waiting for a buyer sounds like its own second job, A more direct path can avoid agent commissions, repair lists, and waiting on a buyer’s financing to close.

Some cash home buyers purchase homes as-is, basing offers on After Repaired Value rather than requiring repairs first. This approach fits homeowners who inherited a property they don’t want to manage, need cash quickly, or want to avoid showings and uncertainty of a traditional listing. There’s no cleaning, no staging, and no negotiating with buyers over inspection reports.
If you’ve run the rent-versus-sell numbers and selling is the right call, request a no-obligation cash offer and find out what your home is worth on your timeline, not the market’s.
Sources
- Renting vs. Selling Your Home: The 2026 Decision Framework
- Should You Rent or Sell Your Home When You Move? | Kiplinger
- Should I sell my home or rent it out? (2026 Calculator) – FinFam
- Should I Sell My House or Rent It Out? | Experian
This article is general information, not a substitute for advice from a qualified financial advisor. Consult a qualified financial professional about your own circumstances before acting on anything here.
FAQ
Is It Better to Keep a Rental or Sell It?
It depends on whether the rental generates positive after-tax cash flow once vacancy, maintenance, and management costs are subtracted, and whether you’re still inside your Section 121 window. If both favor renting, keeping it often builds more long-term wealth; if either is shaky, selling usually comes out ahead.
What Is the 2% Rule for Rentals?
Former primary residences rarely hit that ratio, which is part of why they often underperform purpose-bought rental properties.
What Is the 5% Rule for Rent vs Buy?
It’s a general homeownership comparison tool rather than a precise rent-versus-sell calculator.
What Is the 30% Rule for Rent?
It’s a household budgeting guideline for tenants and doesn’t directly answer whether a homeowner should rent out or sell a property.